I have an opinion piece in today’s New York Times. I will run in the Sunday print edition. Regular readers of Ramble will recognize some of the scenes and characters: bloodroot and foxes in Shakerag Hollow. I hope you’ll consider reading, sharing, and commenting. The Times loves to see reader engagement. So far, people are weighing in with their own experiences and thoughts about the seasons.
The Times requires a fact-checked version of articles from all contributors. I’ve pasted below a shortened version of what I provided to them (minus the pdfs of relevant scientific articles and some longer quotes from papers). In the so-called “fake news” era, it’s important to note that some news outlets have a strong commitment to getting the facts right. Whether we agree with “opinion” is another matter, of course.
Abbreviated list of sources:
Observations of early spring:
Peepers calling in Nashville: Personal observation at Shelby Bottoms, on Jan 28th (with chorus frogs) and Feb 11th (in very large numbers). (Feb 22nd with other frogs in large numbers, Lake Cheston, Sewanee, TN.)
Red maples in bloom in New York before snow storm:
https://www.nycgovparks.org/highlights/signs-of-spring-in-nyc-parks
https://twitter.com/NYCParks/status/839905231932579840
Bloodroot in February: In Shakerag Hollow, Sewanee, TN, Feb 24th several in full bloom.
Flying queen ants and spring azures: Feb 19th. Elliott Point, Sewanee.
Emergence dates for quince, multiflora rose, Bradford pears: in the town of Sewanee, TN.
Teens in March: nights of March 14th and 15th in Sewanee, TN.
Privet, bittersweet and honeysuckle earliest to leaf out: In Sewanee, TN.
Changes in phenology in northern hemisphere:
2.8/days per decade is from: Parmesan, Camille. “Influences of species, latitudes and methodologies on estimates of phenological response to global warming.” Global Change Biology 13.9 (2007): 1860-1872.
“A meta-analysis spanning 203 species was conducted on published datasets from the northern hemisphere.” “Analyses here on a new expanded dataset estimate an overall spring advancement across the northern hemisphere of 2.8 days/decade”
See also (same trend, somewhat different quantification of rates):
Abu-Asab, Mones S., et al. “Earlier plant flowering in spring as a response to global warming in the Washington, DC, area.” Biodiversity and Conservation 10.4 (2001): 597-612.
Jeong, Su‐Jong, et al. “Phenology shifts at start vs. end of growing season in temperate vegetation over the Northern Hemisphere for the period 1982–2008.” Global Change Biology 17.7 (2011): 2385-2399.
Schwartz, Mark D., Rein Ahas, and Anto Aasa. “Onset of spring starting earlier across the Northern Hemisphere.” Global Change Biology 12.2 (2006): 343-351.
http://onlinelibrary.wiley.com/doi/10.1111/j.1365-2486.2005.01097.x/full
“Results are consistent with prior smaller area studies, confirming a nearly universal quicker onset of early spring warmth (spring indices (SI) first leaf date, −1.2 days decade−1), late spring warmth (SI first bloom date, −1.0 days decade−1; last spring day below 5°C, −1.4 days decade−1), and last spring freeze date (−1.5 days decade−1) across most temperate NH land regions over the 1955–2002 period.”
Time lapse, National Phenology Network, cherries, and NOAA temperature data:
Time lapse: https://www.nytimes.com/interactive/2017/03/08/climate/early-spring.html
Phenology network: https://www.usanpn.org/
Cherry bloom in Washington DC: https://www.nps.gov/subjects/cherryblossom/bloom-watch.htm
And, for damage from combination of warm February then March freeze: https://www.washingtonpost.com/news/capital-weather-gang/wp/2017/03/09/cherry-blossoms-could-be-seriously-damaged-by-upcoming-cold-snap/?utm_term=.d1f4902fcbde
NOAA data on February temperature records: http://www.noaa.gov/news/us-had-2nd-warmest-february-and-6th-warmest-winter-on-record “Most locations across the contiguous U.S. were warmer than average during February. Thirty-nine states from the Rockies to the East Coast were much warmer than average, with 16 states across the South, Midwest, Mid-Atlantic and Northeast record warm. Below- to near-average temperatures were observed for the Northwest, with no state ranking record cold.” And, in the final report: https://www.ncdc.noaa.gov/sotc/national/201702 “Thirty-six states had maximum temperatures that were much above average, with 19 states in the Southern Plains, Midwest, and along the East Coast having record warm maximum temperatures.”
NOAA projections for next 2-3 months: http://www.cpc.ncep.noaa.gov/products/predictions/long_range/seasonal.php?lead=1
The USA National Phenology Network
Maps are based on:
“The Real-Time Mesoscale Analysis (RTMA) is a NOAA/NCEP high-spatial and temporal resolution analysis/assimilation system for near-surf ace weather conditions. Its main component is the NCEP/EMC Gridpoint Statistical Interpolation (GSI) system applied in two-dimensional variational mode to assimilate conventional and satellite-derived observations. “ http://nomads.ncep.noaa.gov/txt_descriptions/RTMA_doc.shtml
And on:
Ault, T. R., M. D. Schwartz, R. Zurita-Milla, J. F. Weltzin, and J. L. Betancourt (2015): Trends and natural variability of North American spring onset as evaluated by a new gridded dataset of spring indices. Journal of Climate 28: 8363-8378.
“This dataset is derived from daily interpolated meteorological data, and results are compared with historical station data to ensure the trends and variations are robust. Regional trends in the first leaf index range from −0.6 to −1.7 days per decade, while first bloom index trends are between −0.2 and −1.4 for most regions.”
Summary of model at: https://data.globalchange.gov/report/indicator-start-of-spring
“The model is based on (1) long-term observations of lilac and honeysuckle first-leaf and first-bloom, collected by citizen science volunteers at hundreds of sites across the contiguous United States, and (2) daily minimum and maximum temperatures measured at weather stations.”
Satellite data on changing seasonality around the globe:
Buitenwerf, Robert, Laura Rose, and Steven I. Higgins. “Three decades of multi-dimensional change in global leaf phenology.” Nature Climate Change 5.4 (2015): 364-368. http://www.nature.com/nclimate/journal/v5/n4/full/nclimate2533.html
“We found that leaf phenology changed substantially in most regions of the world, with 95% of the land surface changing by at least 1 s.d. for at least one metric.” And “We show that the phenology of vegetation activity changed severely (by more than 2 standard deviations in one or more dimensions of phenological change) on 54% of the global land surface between 1981 and 2012.”
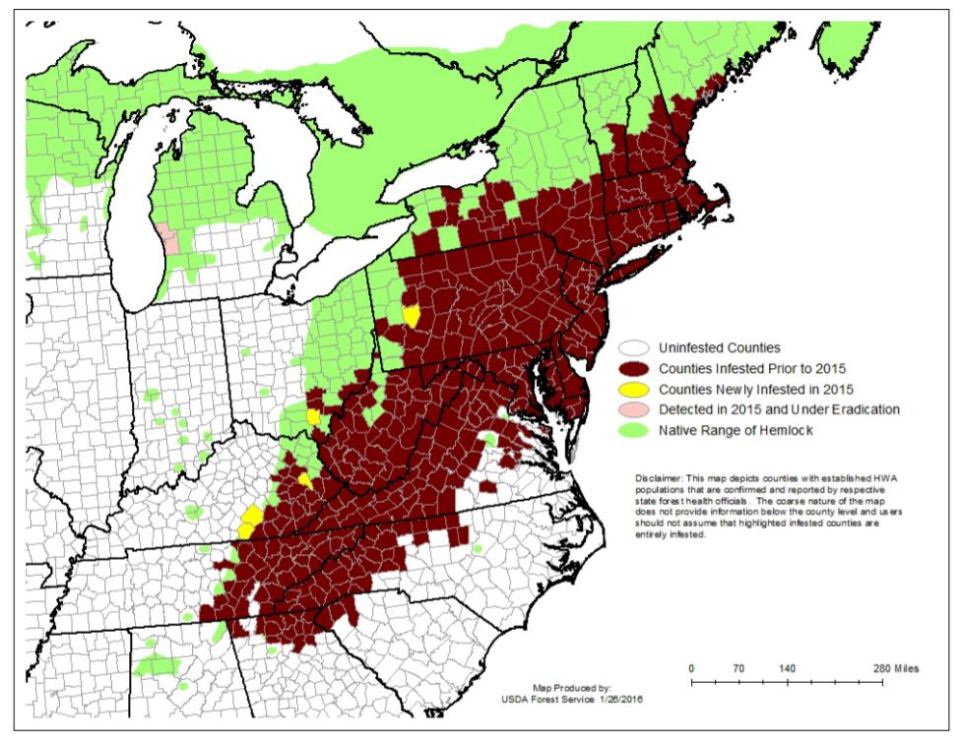
Climate change and plant invasions:
Bradley, Bethany A., David S. Wilcove, and Michael Oppenheimer. “Climate change increases risk of plant invasion in the Eastern United States.” Biological Invasions 12.6 (2010): 1855-1872.
https://link.springer.com/article/10.1007/s10530-009-9597-y
“Climate change is likely to enable all three species to greatly expand their ranges. Risk from privet and kudzu expands north into Ohio, Pennsylvania, New York, and New England states by 2100. Risk from cogongrass expands as far north as Kentucky and Virginia. Heightened surveillance and prompt eradication of small pockets of invasion in northern states should be a management priority”
See also:
Polgar, Caroline, Amanda Gallinat, and Richard B. Primack. “Drivers of leaf‐out phenology and their implications for species invasions: insights from Thoreau’s Concord.” New Phytologist 202.1 (2014): 106-115.
http://onlinelibrary.wiley.com/doi/10.1111/nph.12647/full
“Woody species are now leafing out an average of 18 d earlier than they did in the 1850s, and are advancing at a rate of 5 ± 1 d °C−1.” “…invasive shrubs generally have weaker chilling requirements … leaf out faster in the laboratory and earlier in the field; native trees have the strongest chilling requirements.”
Hulme, Philip E. “Contrasting impacts of climate‐driven flowering phenology on changes in alien and native plant species distributions.” New Phytologist 189.1 (2011): 272-281.
http://onlinelibrary.wiley.com/doi/10.1111/nph.12647/full
“Native plant species whose phenology did not track climate change declined in distribution, whereas species that became more widespread all exhibited earlier flowering. In contrast, alien neophytes showed both a stronger phenological response to warming and a more marked increase in distribution, but no link between the two.”
Timing of birds:
La Sorte, Frank A., et al. “The implications of mid‐latitude climate extremes for North American migratory bird populations.” Ecosphere 7.3 (2016).
http://onlinelibrary.wiley.com/doi/10.1002/ecs2.1261/full
“Our findings suggest short-distance migrants are more flexible and resilient, whereas populations of long-distance migrants are at a distinct disadvantage, which may intensify if the frequency of these events increases.”
Both, Christiaan, et al. “Climate change and population declines in a long-distance migratory bird.” Nature 441.7089 (2006): 81-83.
http://www.nature.com/nature/journal/v441/n7089/abs/nature04539.html
“In a comparison of nine Dutch populations, we find that populations have declined by about 90% over the past two decades in areas where the food for provisioning nestlings peaks early in the season and the birds are currently mistimed. In areas with a late food peak, early-breeding birds still breed at the right time, and there is, at most, a weak population decline.”
Møller, Anders Pape, Diego Rubolini, and Esa Lehikoinen. “Populations of migratory bird species that did not show a phenological response to climate change are declining.” Proceedings of the National Academy of Sciences 105.42 (2008): 16195-16200.
http://www.pnas.org/content/105/42/16195.short
“Species that declined in the period 1990–2000 did not advance their spring migration, whereas those with stable or increasing populations advanced their migration considerably. On the other hand, population trends during 1970–1990 were predicted by breeding habitat type, northernmost breeding latitude, and winter range (with species of agricultural habitat, breeding at northern latitudes, and wintering in Africa showing an unfavorable conservation status), but not by change in migration timing.”
Plasticity in the timing of breeding for songbirds:
Dunn, Peter O., and David W. Winkler. “Effects of climate change on timing of breeding and reproductive success in birds.” Pages 113-128 in Effects of climate change on birds (2010, Oxford Univ Press). Eds: A. P. Møller, W. Fiedler, P. Berthold.
“Plasticity in the timing of breeding appears to be relatively high in many songbirds…because in different years some individuals may vary their breeding dates by almost a month in response to local weather conditions” “Evidence for long-term changes in the phenology of birds is accumulating rapidly from around the world.”
Biological processes affected by climate change:
Scheffers, Brett R., et al. “The broad footprint of climate change from genes to biomes to people.” Science 354.6313 (2016): aaf7671.
http://science.sciencemag.org/content/354/6313/aaf7671
“To do this, we identify a set of core ecological processes (32 in terrestrial and 31 each in marine and freshwater ecosystems) that underpin ecosystem functioning and support services to people. Of the 94 processes considered, 82% show evidence of impact from climate change in the peer-reviewed literature.”
Human psychology of climate change:
van der Linden, Sander, Edward Maibach, and Anthony Leiserowitz. “Improving public engagement with climate change: Five “best practice” insights from psychological science.” Perspectives on Psychological Science 10.6 (2015): 758-763.
Also, not directly cited in final version:
Climate change effects in the ocean:
Poloczanska, Elvira S., et al. “Global imprint of climate change on marine life.” Nature Climate Change 3.10 (2013): 919-925.
http://www.nature.com/nclimate/journal/v3/n10/abs/nclimate1958.html
“We found spring phenology in the ocean has advanced by 4.4±0.7 days dec−1 (4.7±1.1 days dec−1 excluding single-species studies) and summer phenology by 4.4±1.1 days dec−1 (4.0±0.6 days dec−1 excluding single-species studies; Fig. 2b and Table 1).”
“The timing of phytoplankton blooms advanced much faster (6.3±1.6 days dec−1 for multispecies assemblages) than that of plants on land (1.1–3.3 days dec−1; refs 12, 20). Fastest rates of spring advancement were for pelagic animals (invertebrate zooplankton 11.6±2.9 days dec−1, and larval bony fish 11.2±1.7 days dec−1 and Fig. 2b). However, phyto- and zooplankton groups both show slower, and similar, advancement of summer phenology (phytoplankton: 4.6±0.4 days dec−1; invertebrate zooplankton: 4.6±1.0 days dec−1).”
Climate change proceeding at different rates:
Thackeray, Stephen J., et al. “Trophic level asynchrony in rates of phenological change for marine, freshwater and terrestrial environments.” Global Change Biology 16.12 (2010): 3304-3313.
http://onlinelibrary.wiley.com/doi/10.1111/j.1365-2486.2010.02165.x/full
Other:
Post, Eric, et al. “Ecological dynamics across the Arctic associated with recent climate change.” science 325.5946 (2009): 1355-1358.
http://science.sciencemag.org/content/325/5946/1355.short
Thomas, Chris D., et al. “Extinction risk from climate change.” Nature 427.6970 (2004): 145-148. http://www.nature.com/nature/journal/v427/n6970/abs/nature02121.html
Fu, Yongshuo H., et al. “Declining global warming effects on the phenology of spring leaf unfolding.” Nature 526.7571 (2015): 104-107.
http://www.nature.com/nature/journal/v526/n7571/abs/nature15402.html
“Using long-term in situ observations of leaf unfolding for seven dominant European tree species at 1,245 sites, here we show that the apparent response of leaf unfolding to climate warming (ST, expressed in days advance of leaf unfolding per °C warming) has significantly decreased from 1980 to 2013 in all monitored tree species. Averaged across all species and sites, ST decreased by 40% from 4.0 ± 1.8 days °C−1 during 1980–1994 to 2.3 ± 1.6 days °C−1 during 1999–2013. The declining ST was also simulated by chilling-based phenology models, albeit with a weaker decline (24–30%) than observed in situ. The reduction in ST is likely to be partly attributable to reduced chilling.”